Making the information add extra value to the business
ReBOUND provides opportunities for e-commerce to increase sales and improve customer experience
Technology stack
ElasticSearch, LogStash, Kibana, MS SQL Server
Services
Web Development
Domain
Marketplace
Interested?
Estimate a projectAbout the product
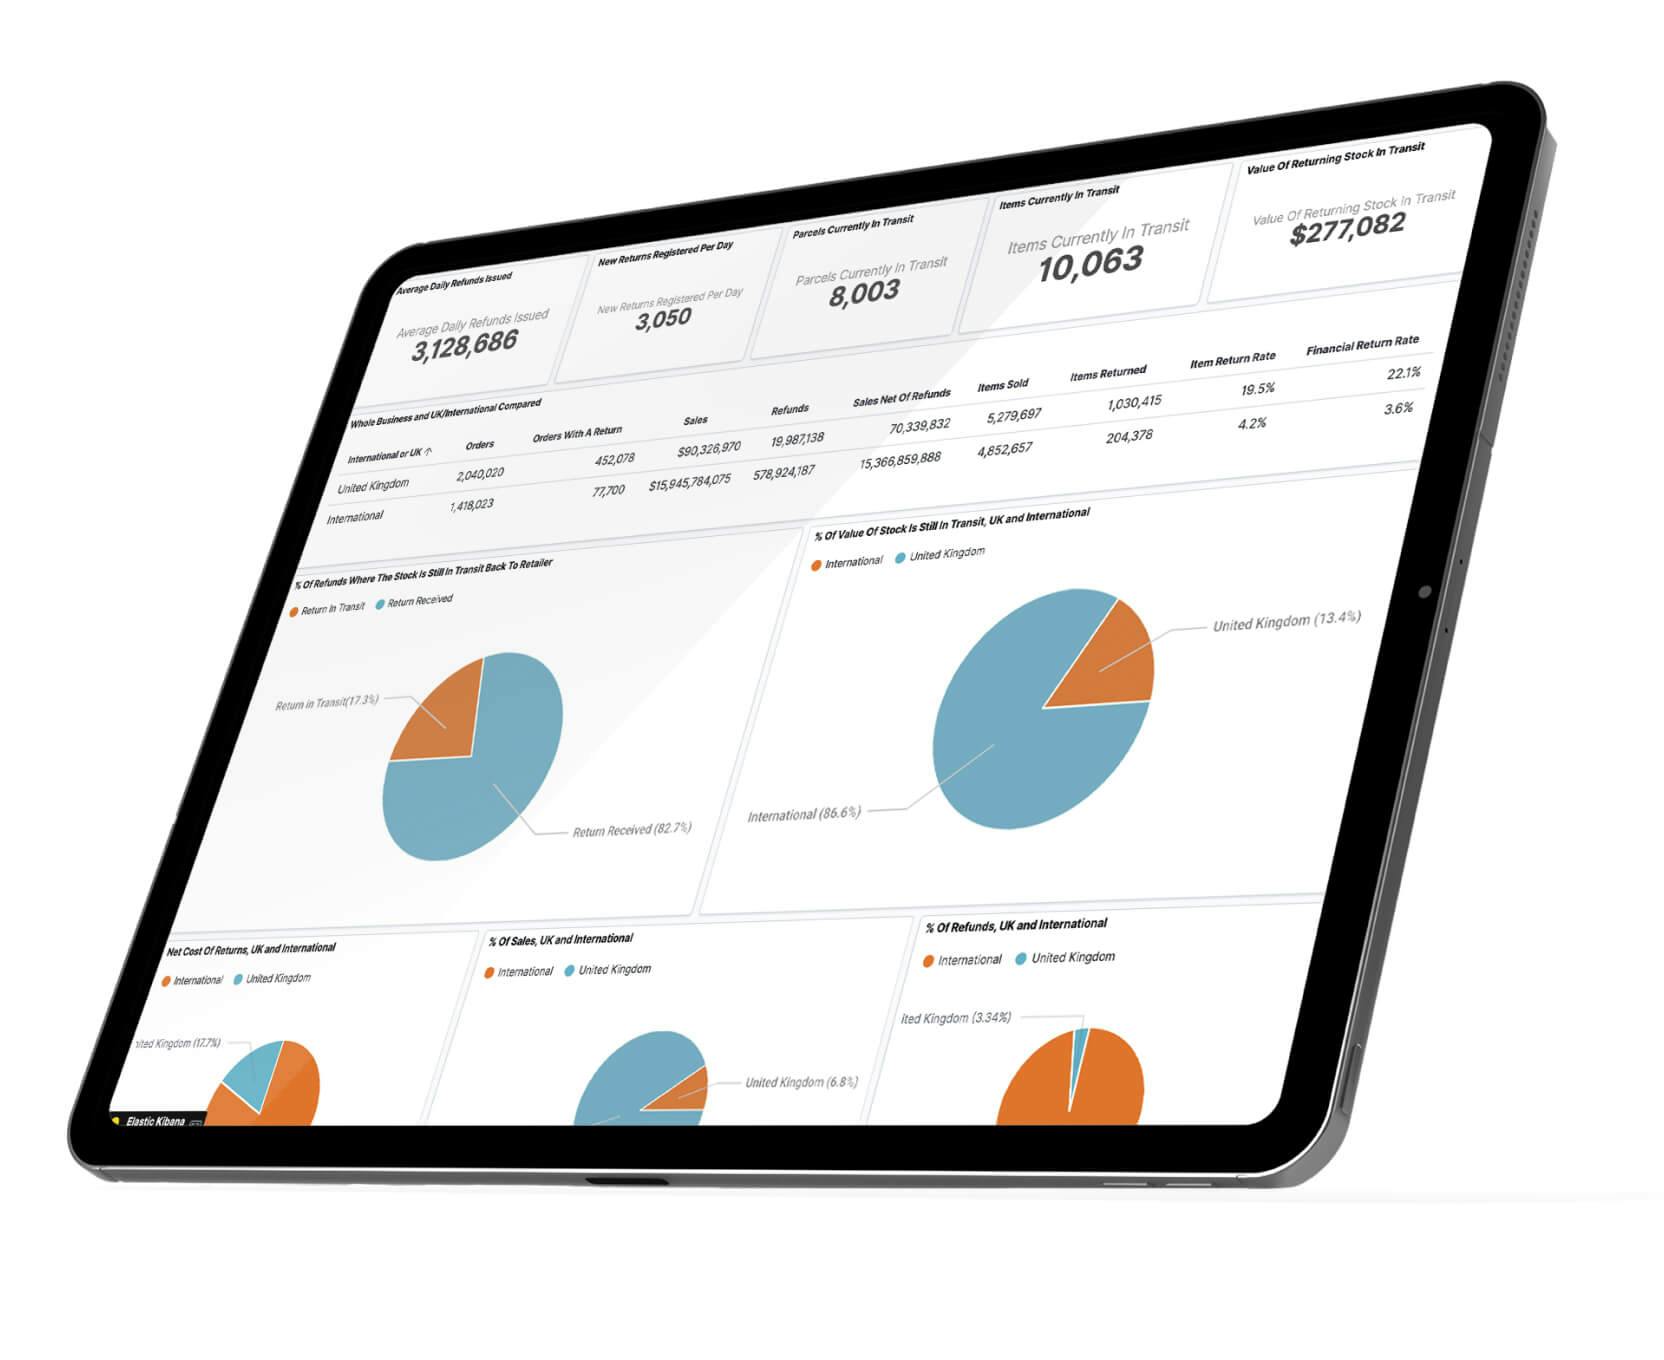
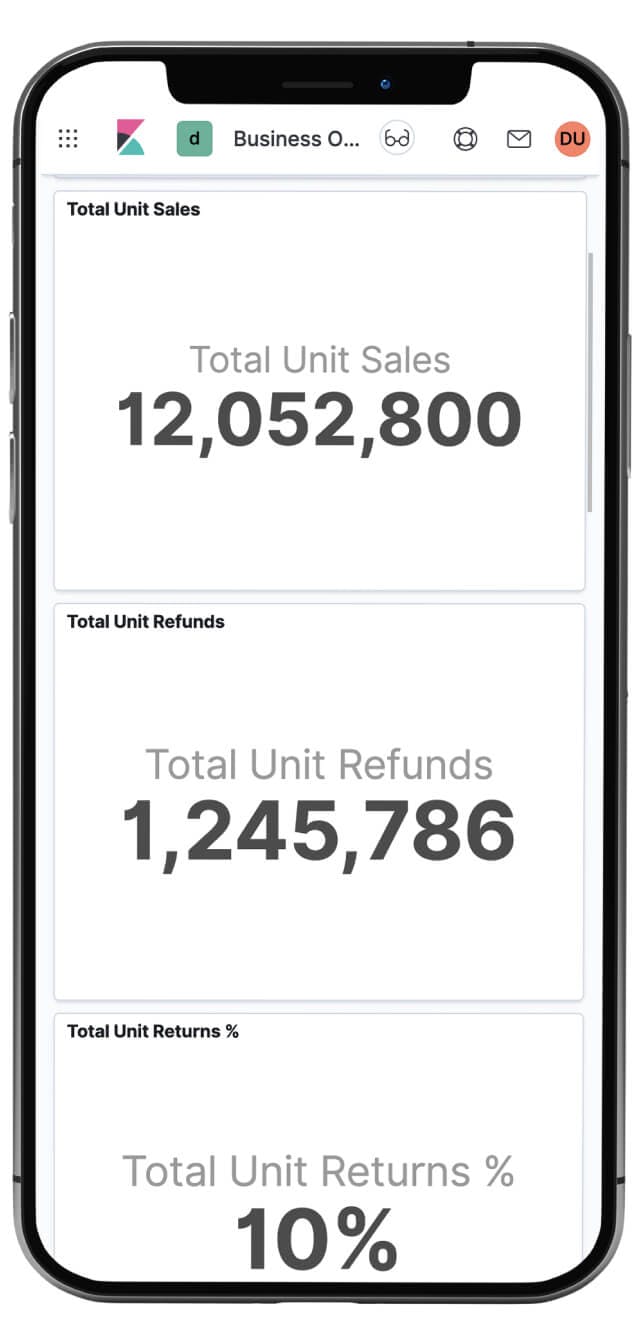
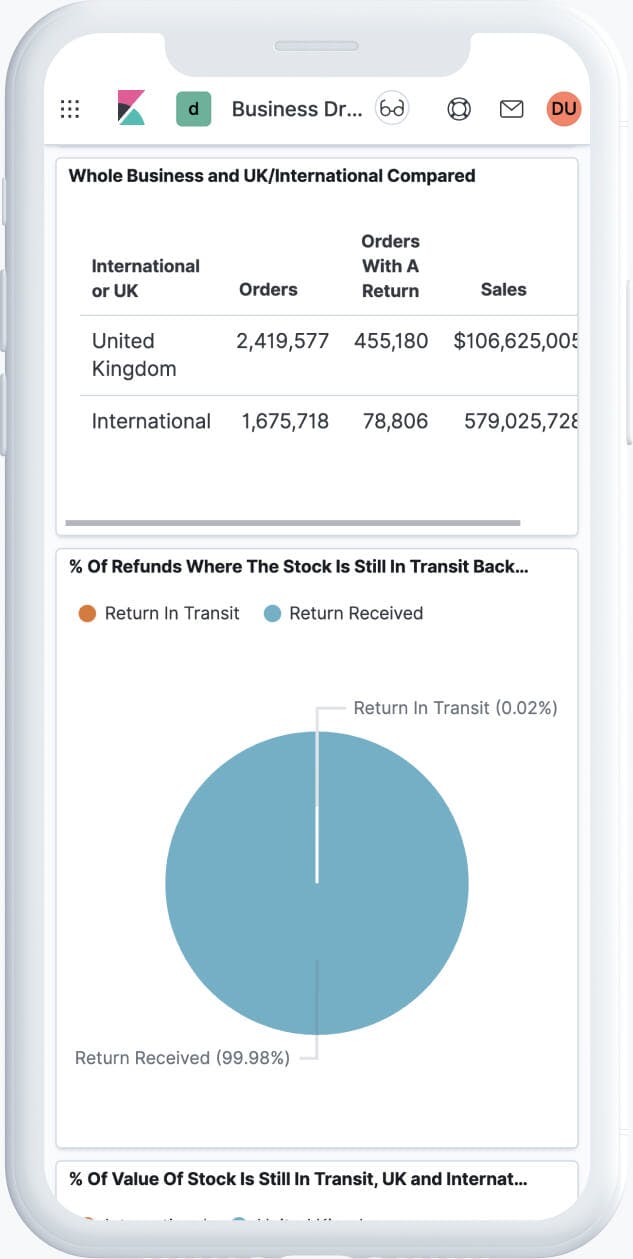
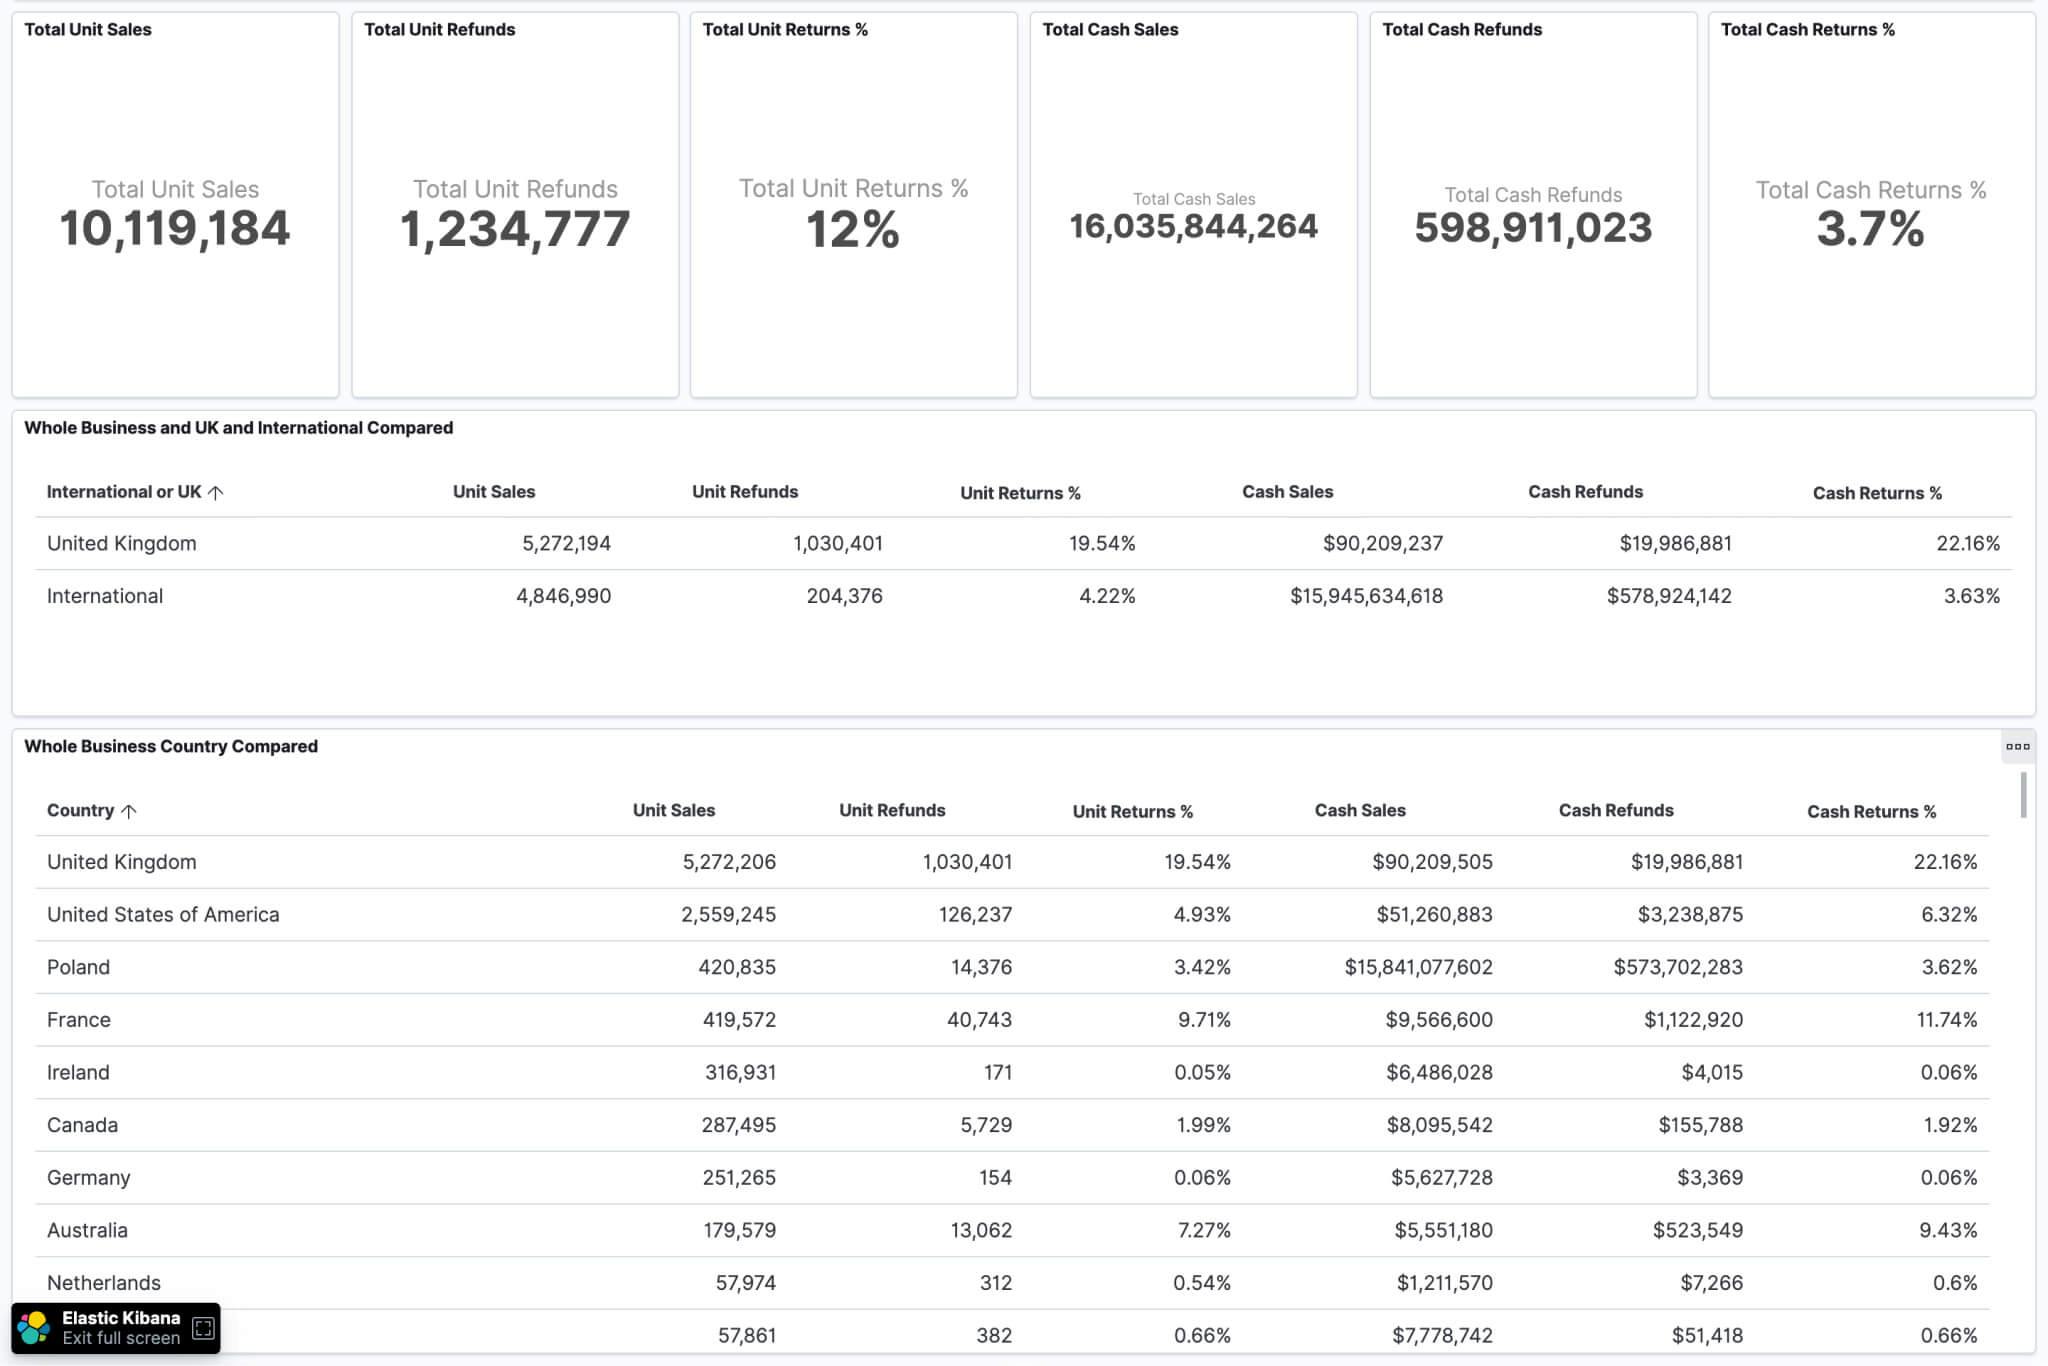
Insights is a complimentary product to the ReBOUND Returns platform. It provides visualized analytics and helps retailers to make data-driven decisions that impact their business.
Dashboard
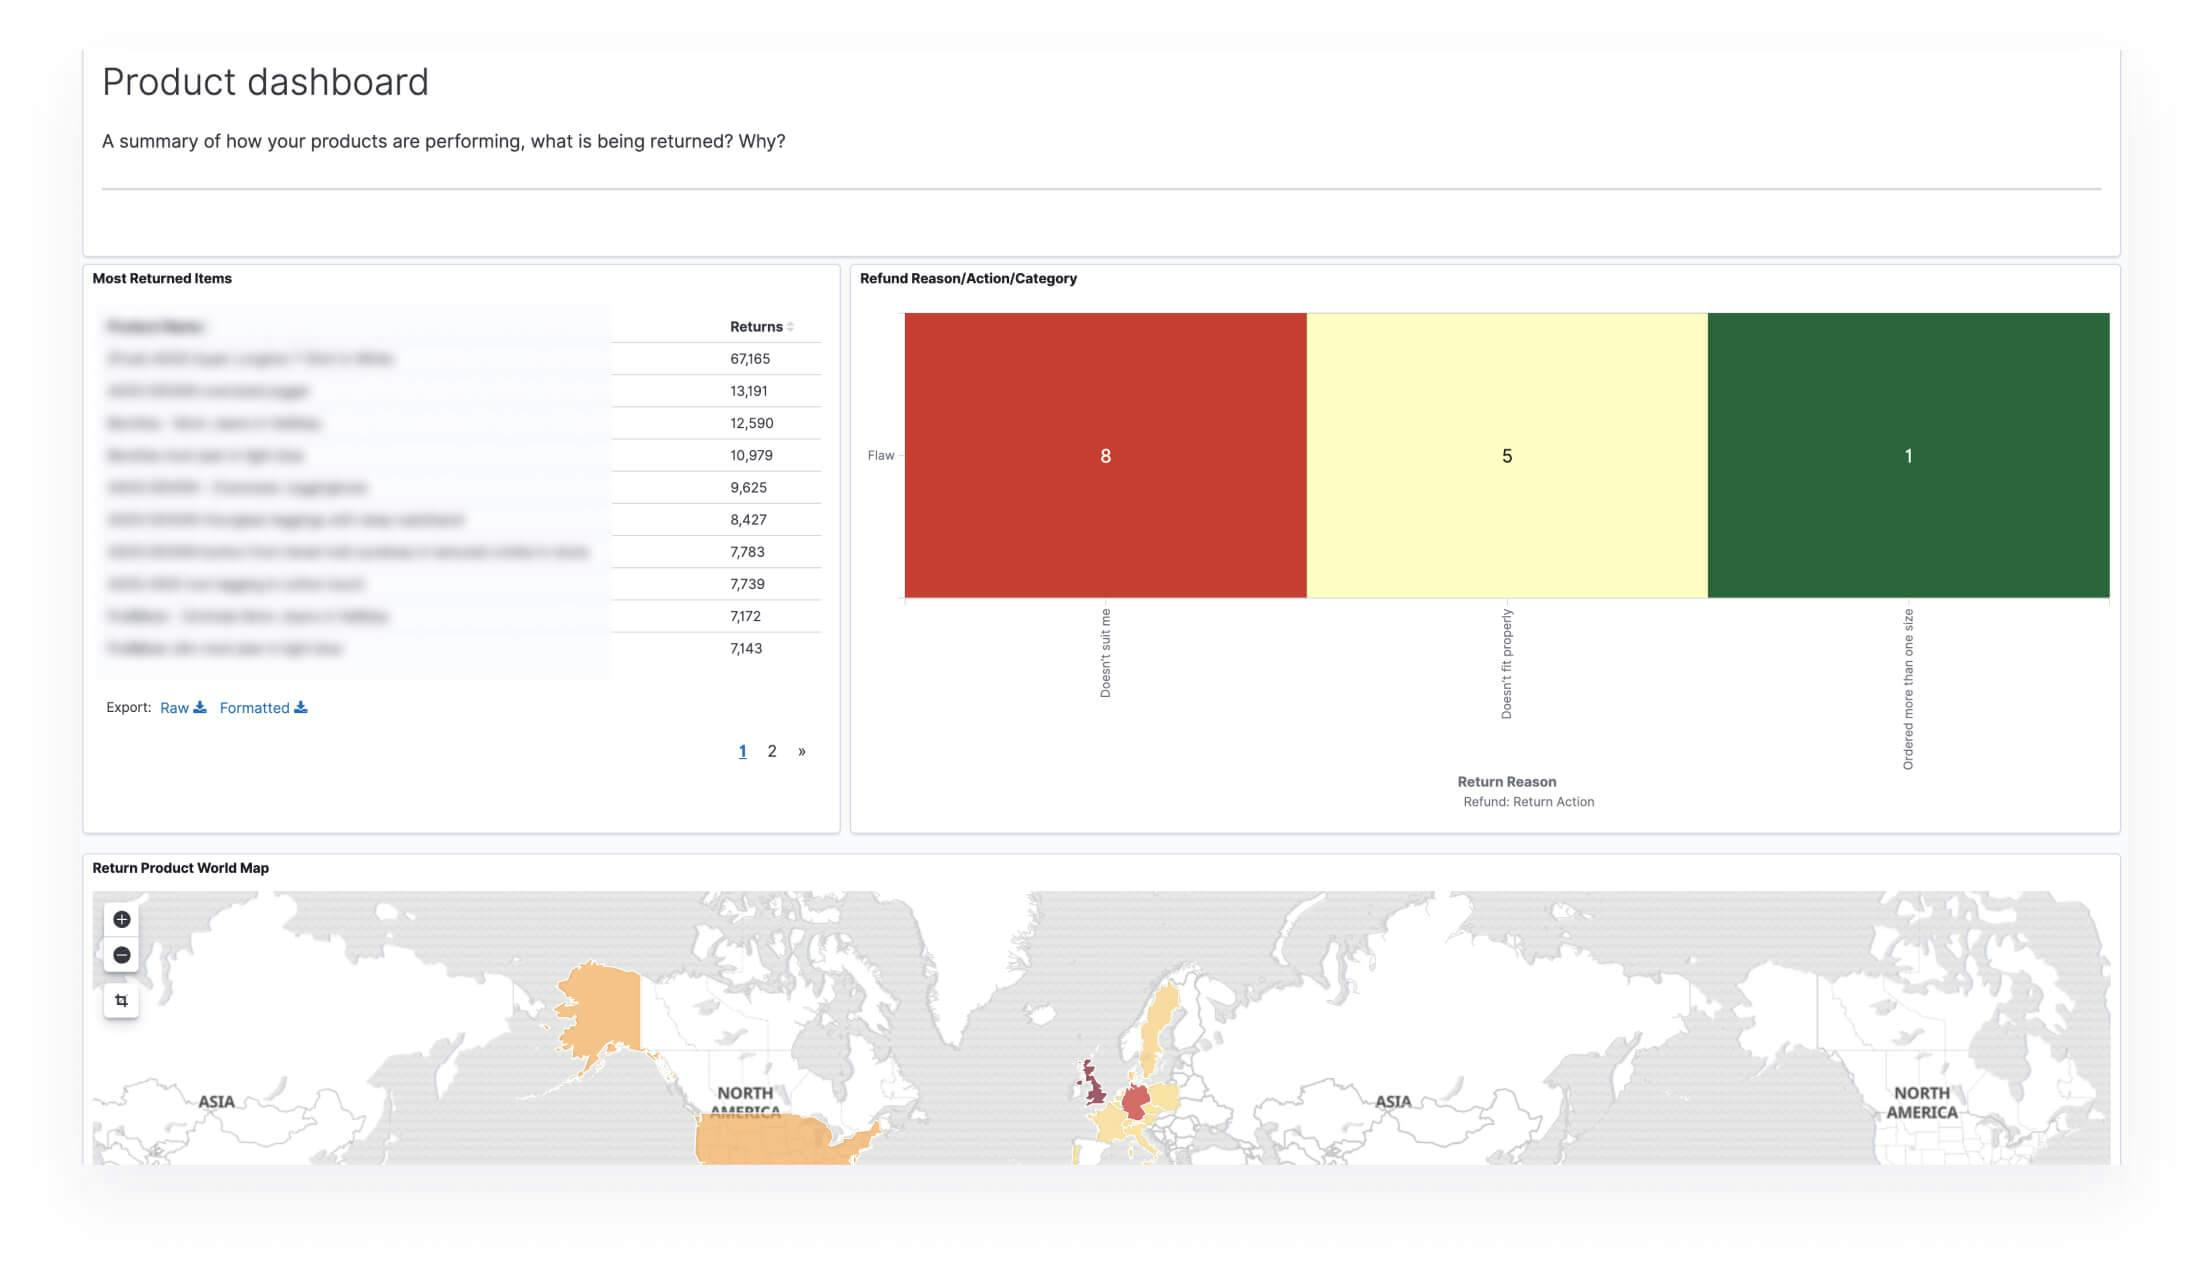
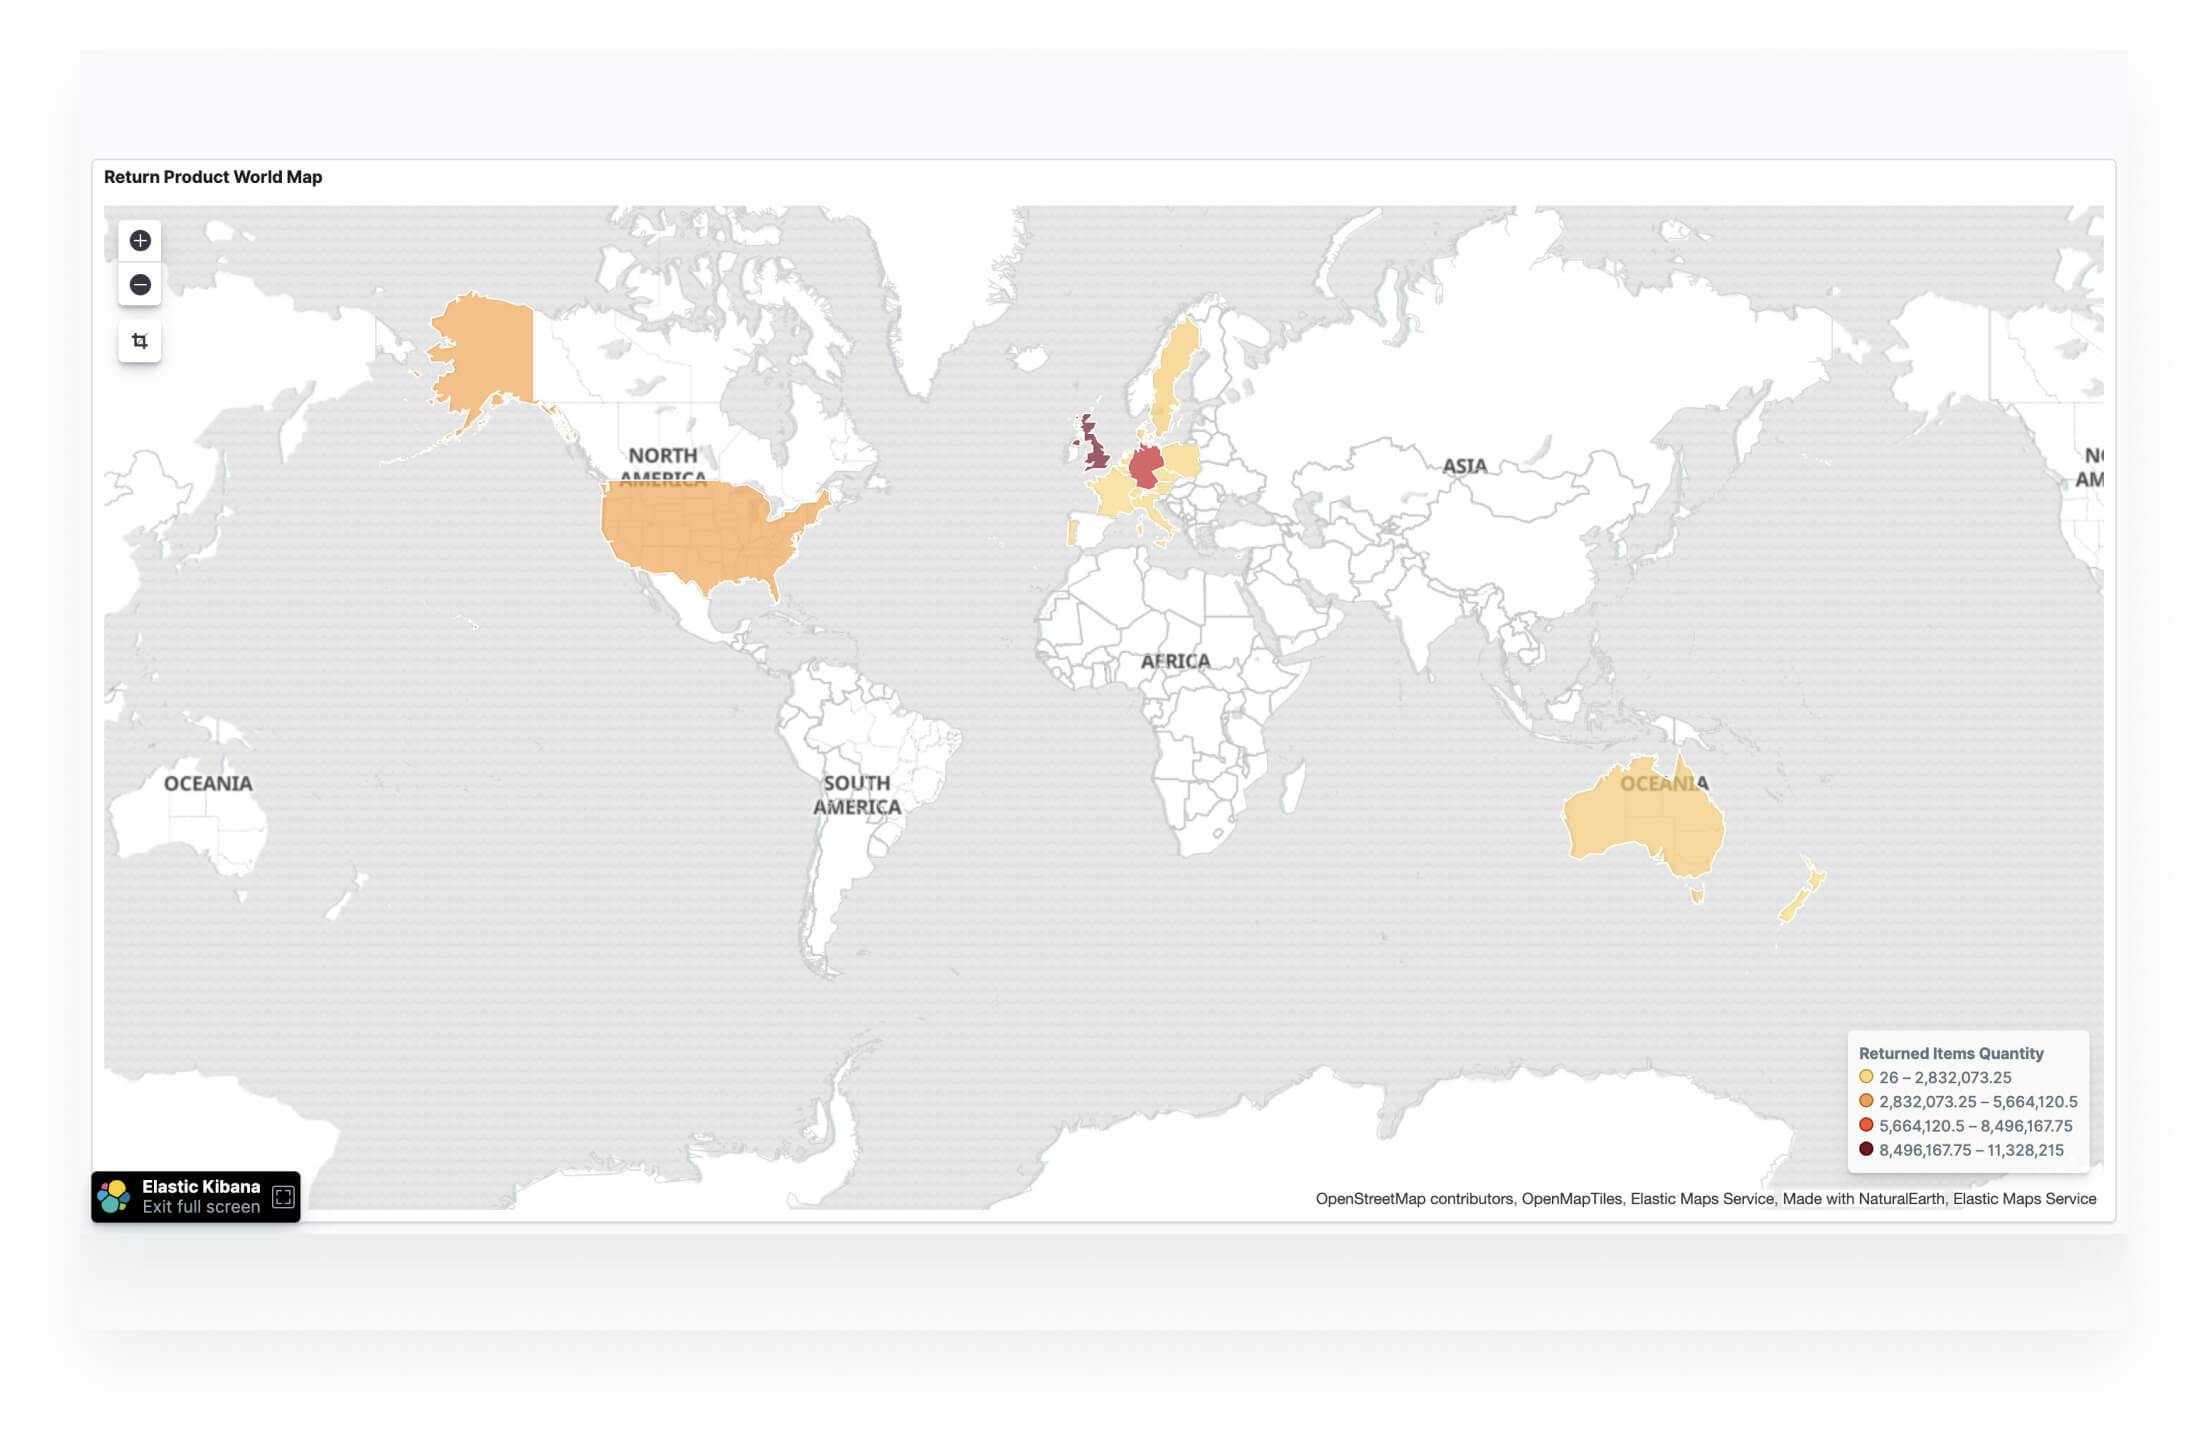
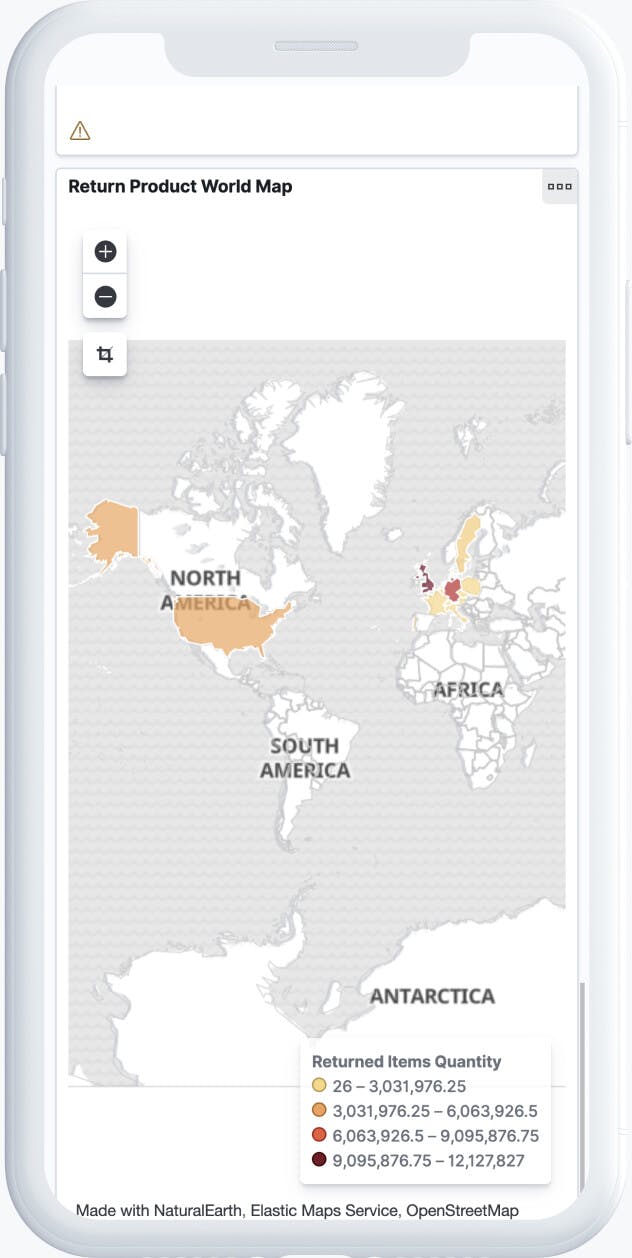
There are several kinds of Dashboards that provide data of different types. For example, Products Dashboard gives insights on the products which are returned most often and breakdown on reasons for returns as well as geographical data for returns.
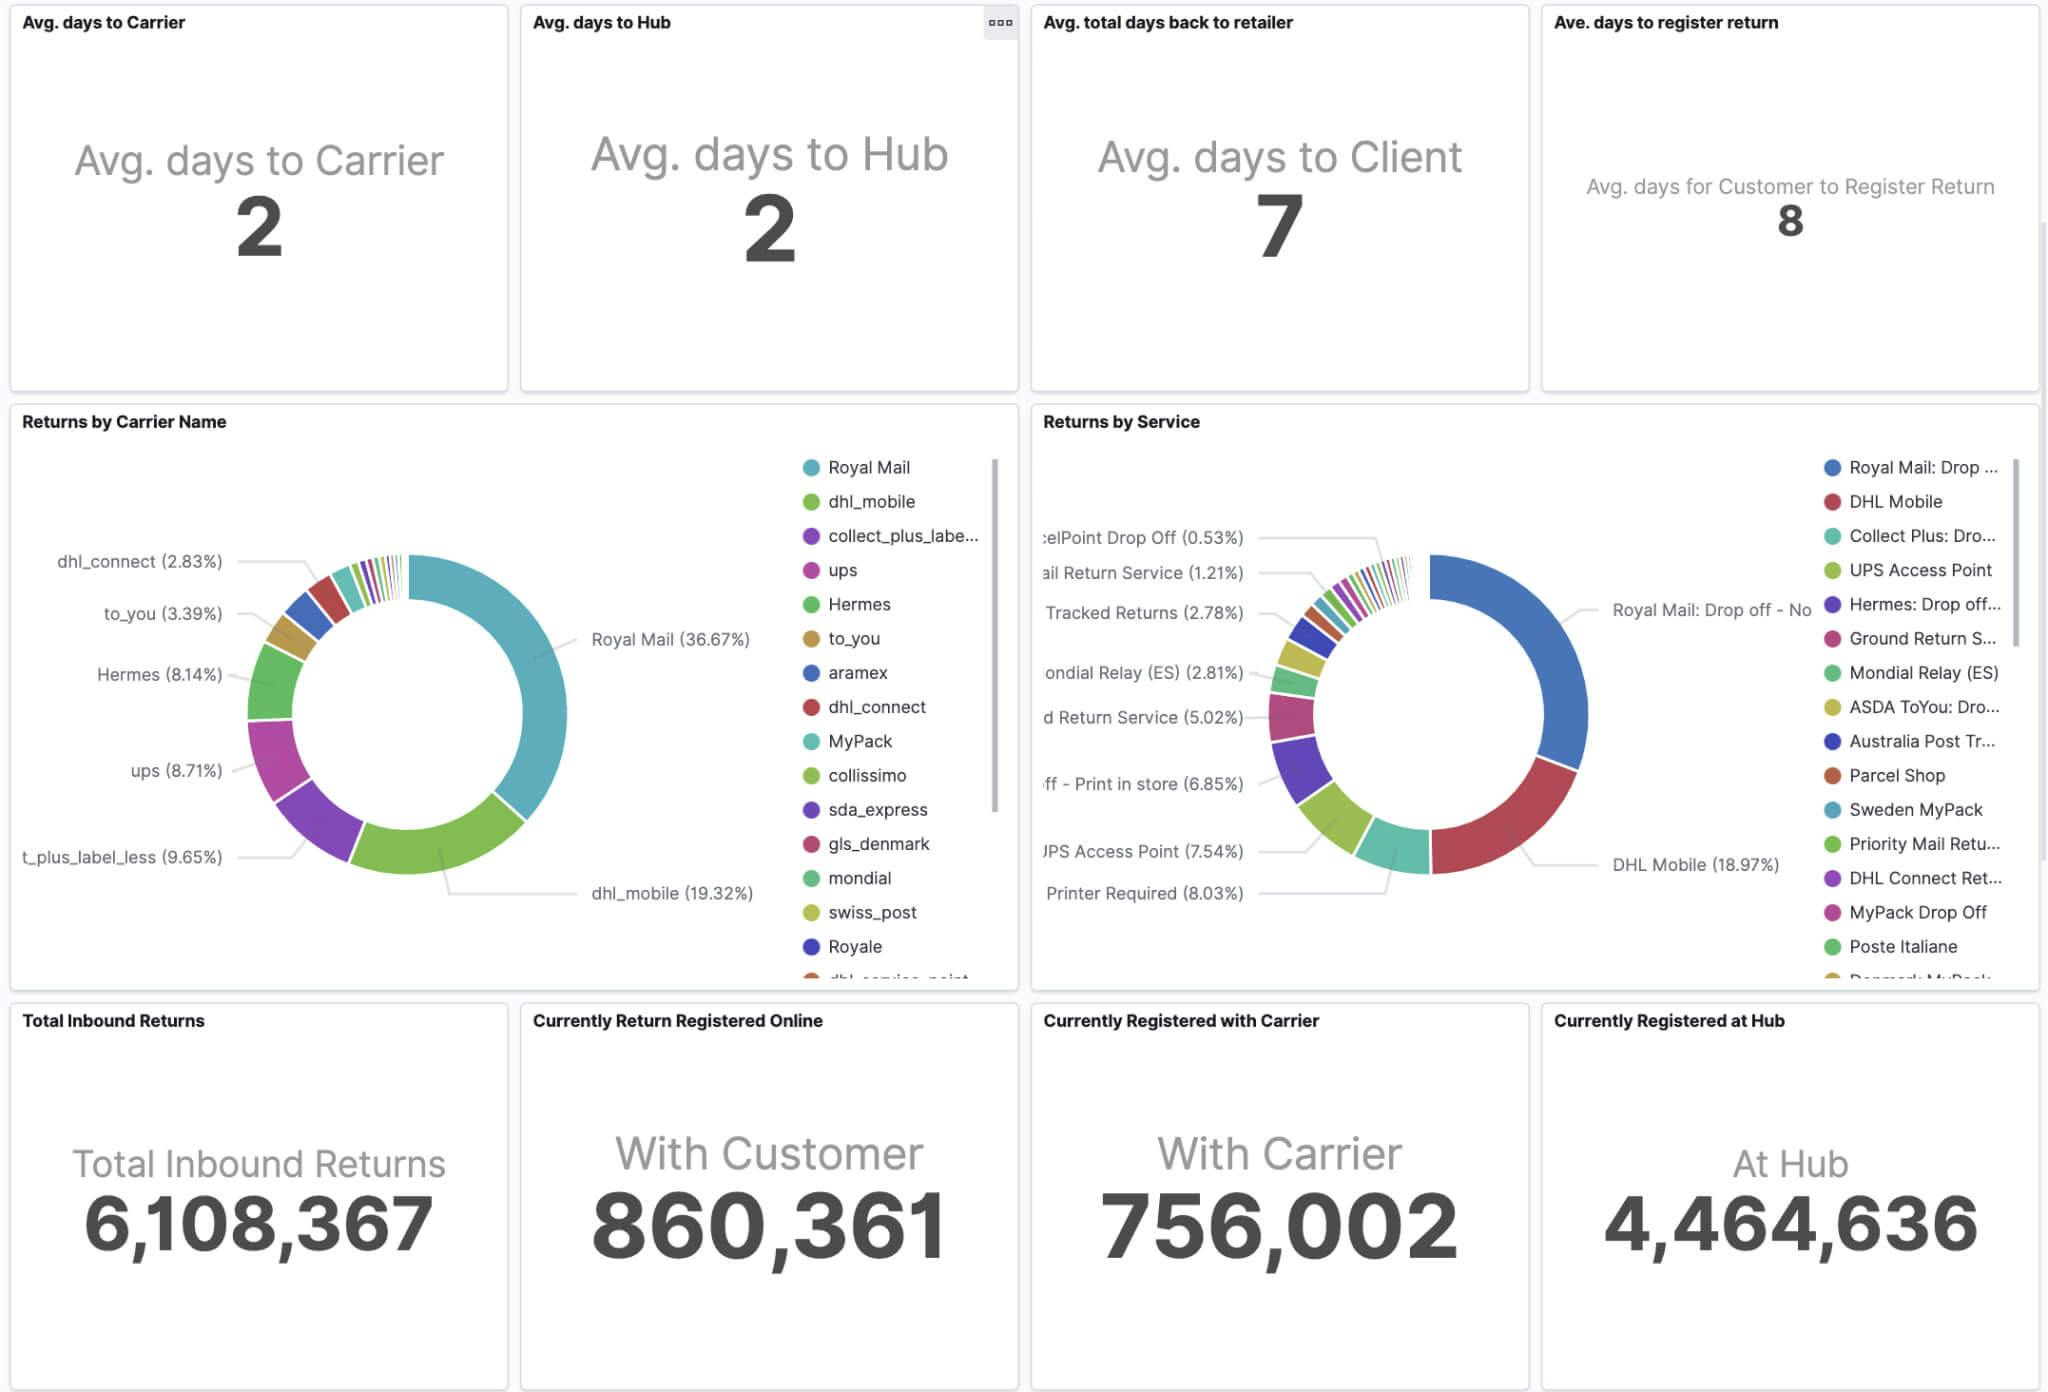
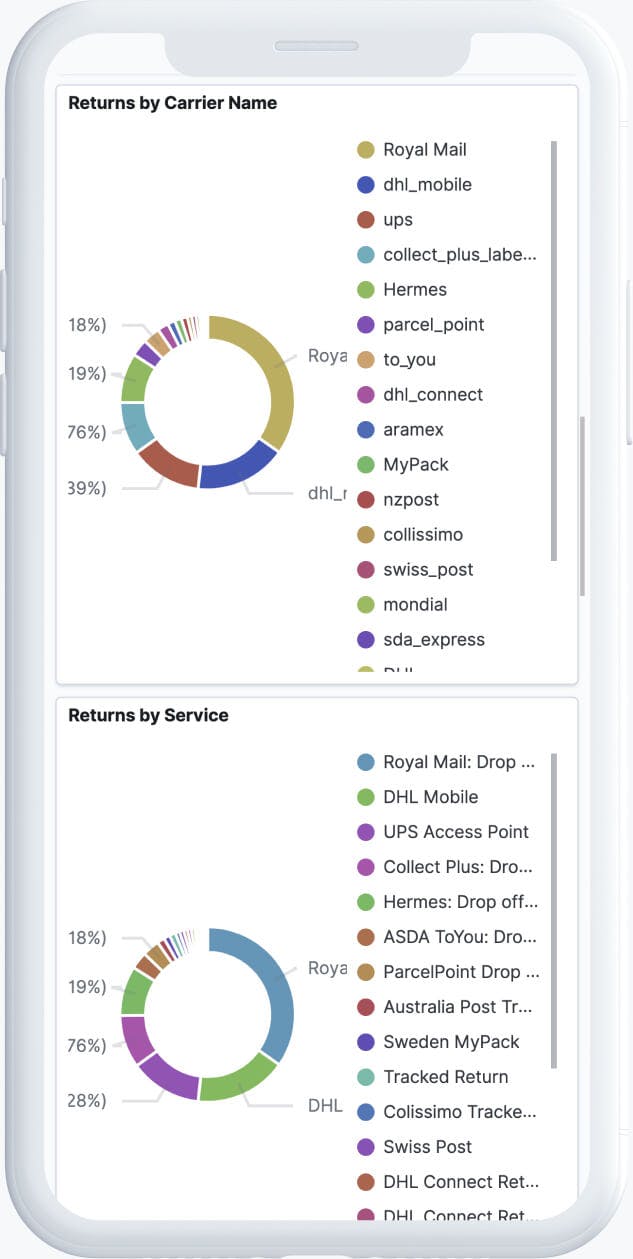
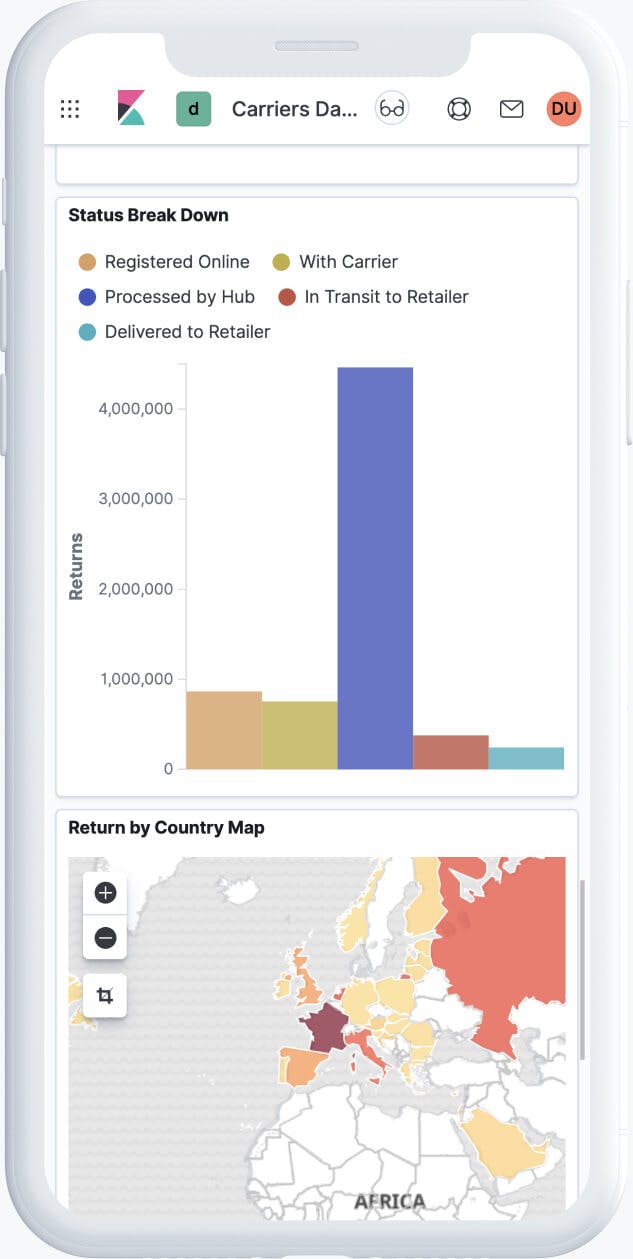
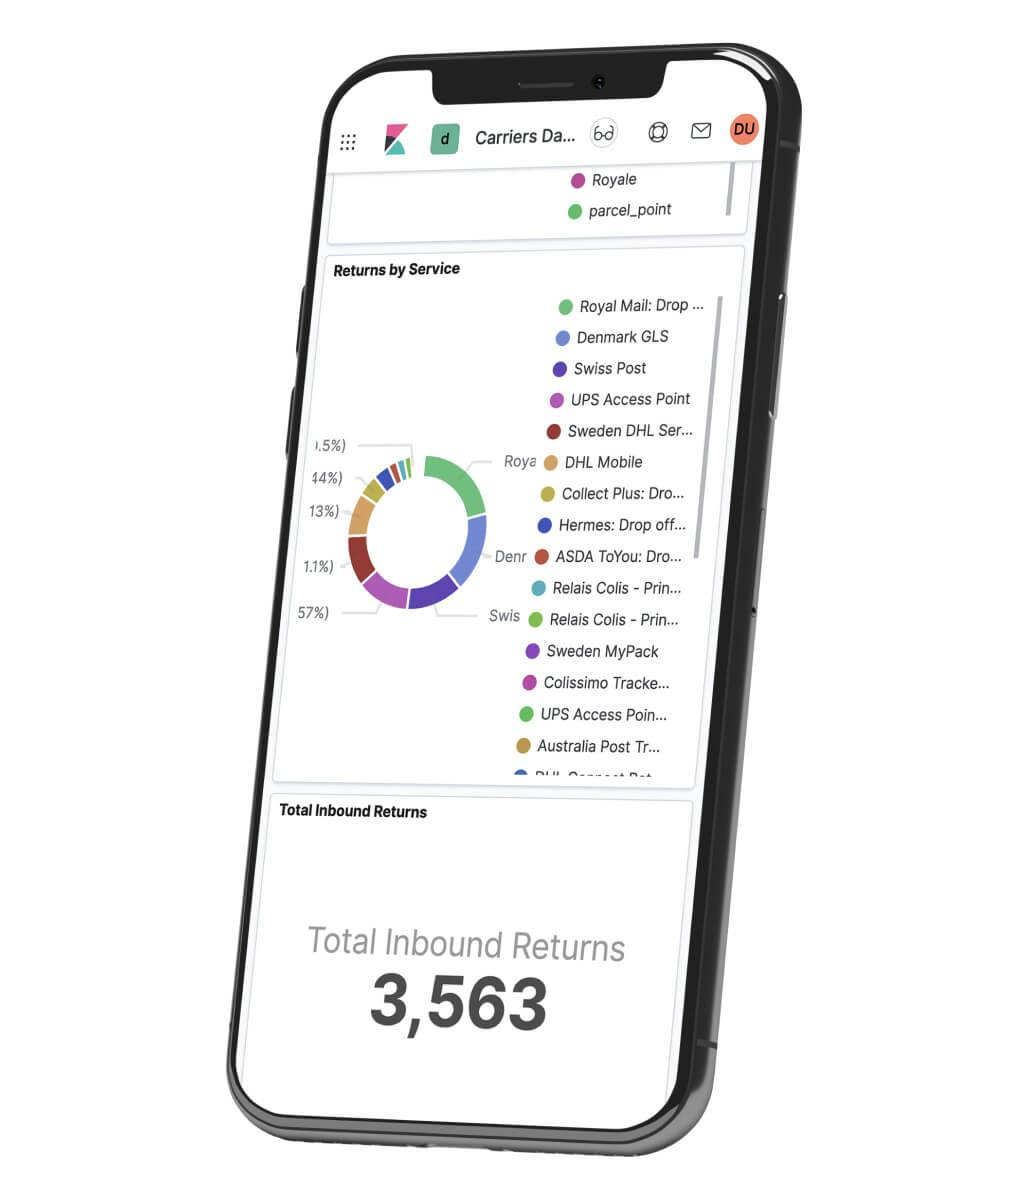
Carriers and Parcel Dashboard gives information on carriers' performance and helps to optimize logistics costs and manage supply partners.
Customer Dashboard provides information on customer behavior and this way serves as a tool do adapt or customize returns policy. From a business perspective, it helps to improve LTV.
Customized advanced analytics
Our team worked on solutions for additional customizations for retailers to fit a wide range of needs. Based on the above-mentioned dashboards we implemented retailer-specific dashboards, made private cloud implementation, and enriched data feed to customers' own data warehouse.
ELK stack as the solution for the product
The product is built using ElasticSearch, LogStash, and Kibana. This stack was chosen as it is scalable and powerful. With the help of ELK, it is possible to store, search, and analyze big volumes of data fast. Kibana allows to visualize information and build beautiful Dashboards.

Outro
DevelopsToday team was working for more than six months in order to build ReBOUND Insights. As a result, we managed to deliver a tool for analytics that brings additional value to e-commerce businesses.
Team
Full Stack Developer – Vladislav N.
Big Data Engineer – Anton K.
Team Leader – Anna K.
Quality Assurance Engineer – Ksenia I.
Have an idea for an analytics tool?
It's a pleasure to have you on our website. Let us know if there's an opportunity for us to do something together.
Drop us a messageBrowse through other success stories
Our case studies describe design and development solutions that we've implemented.
We use cookies to make your experience on the website better. Learn more.
